Nodularity and ferrite / pearlite analysis
A polished cast iron sample is submitted for nodularity analysis. The percentage of ferrite to pearlite analysis is also determined after etching the sample.
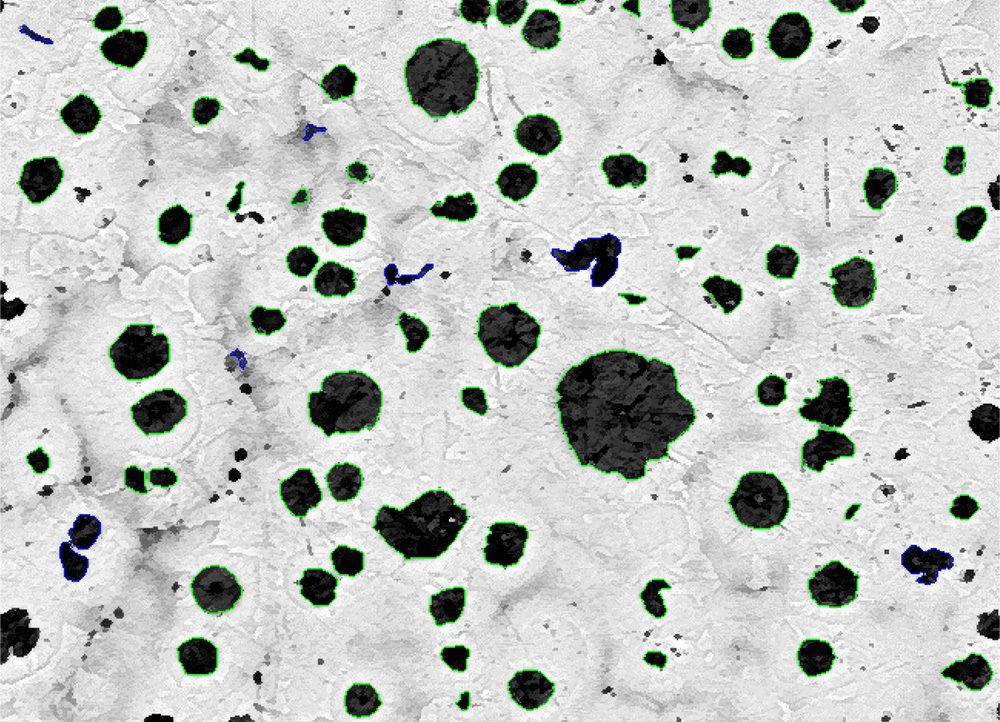
Figure 1. Nodularity analysis. The spherical (0.65) nodules are outlined in green. The rough nodules are outlined in blue. Magnification: 100X.
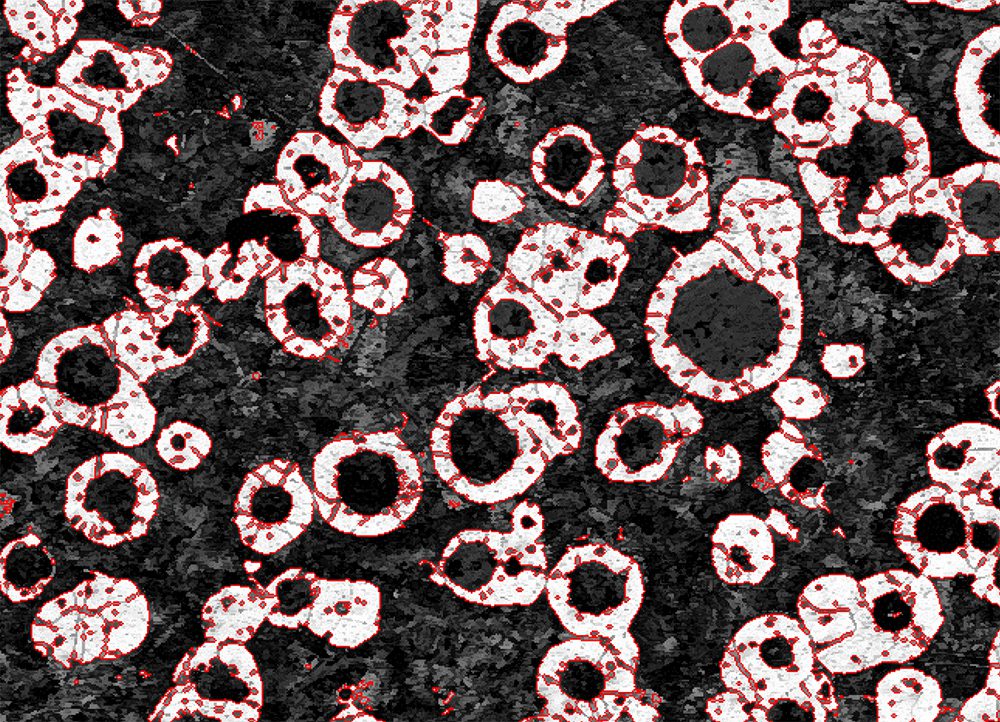
Figure 2. Ferrite / pearlite analysis. The ferrite is outlined in red. The dark phase contains graphite nodules and pearlite. Deducing the nodular percentage from the total dark phase percentage gives the pearlite content.
PURPOSE
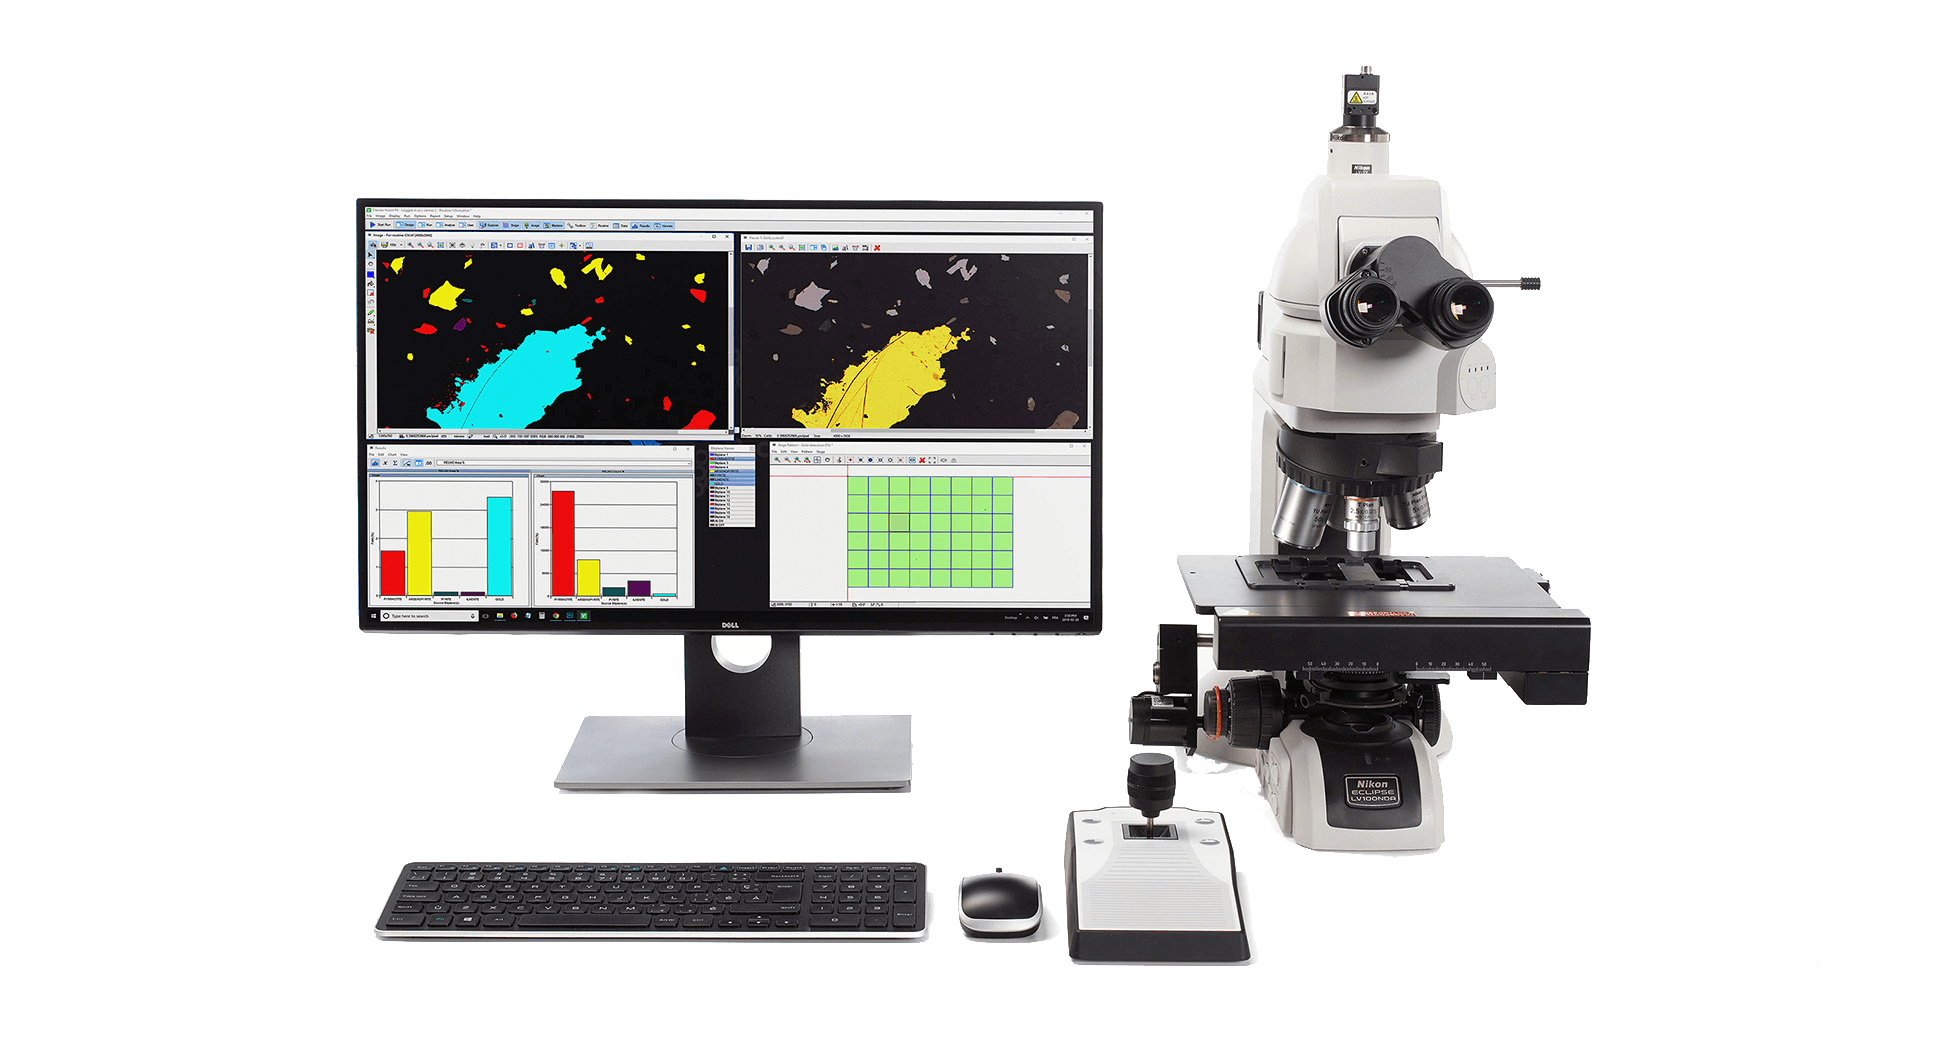
Demonstrate the ability of the Clemex Vision image analysis system can apply nodularity analysis and measure the ferrite to pearlite ratio on cast iron. The methods and operations used are discussed in the report linked at the bottom of this page (click the Download PDF link below).
RESULTS
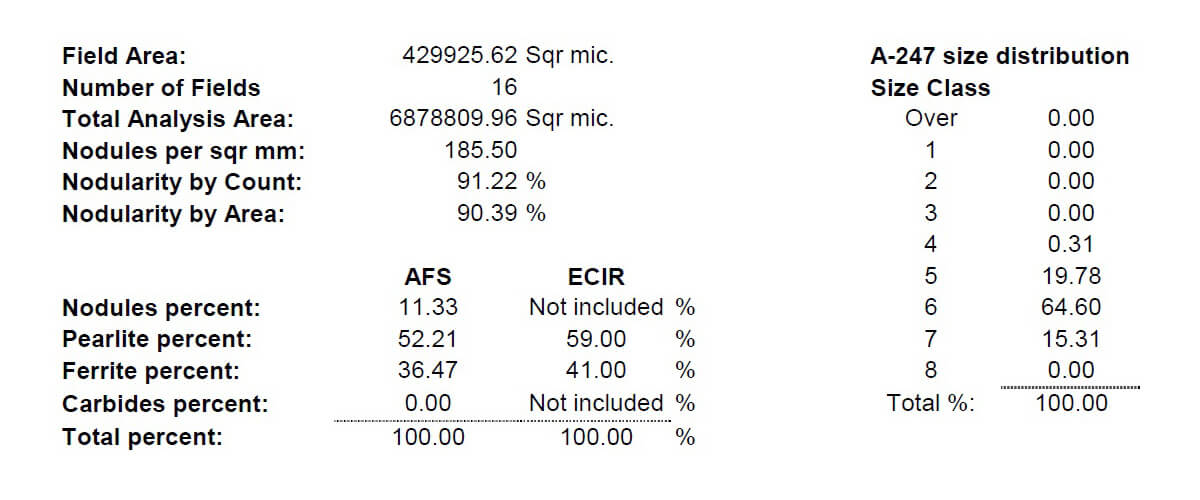
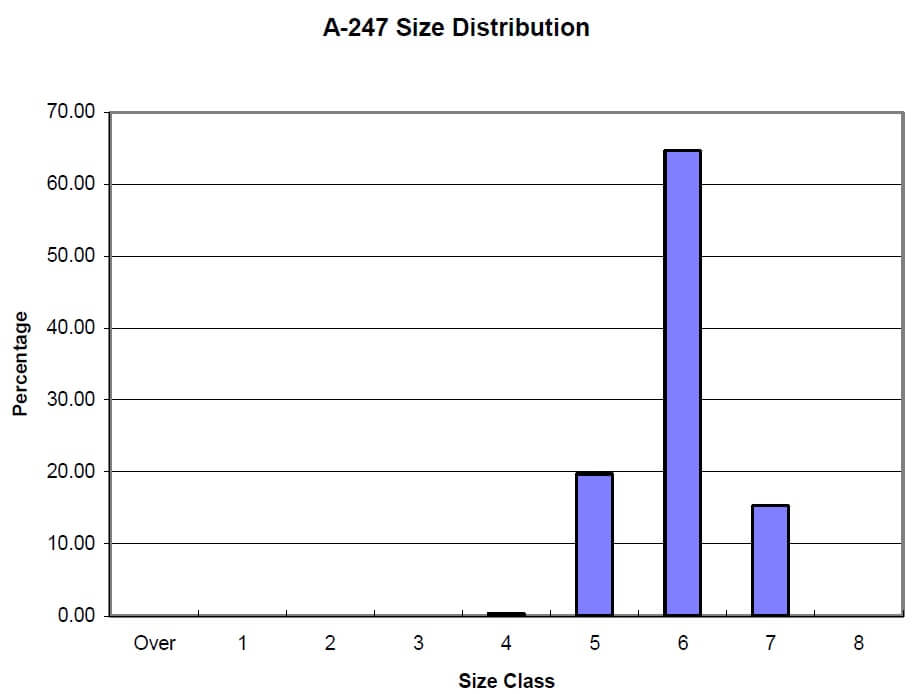
Measurements were performed on each distinct feature from the field of view. Automated statistics and graphs were generated and would be cumulated if analyzing several images. Final results can be printed directly from Clemex Vision. Raw data are linked to their respective objects for validation purpose. Raw data can also be exported in Excel format allowing to build an automated macro to find the size class.