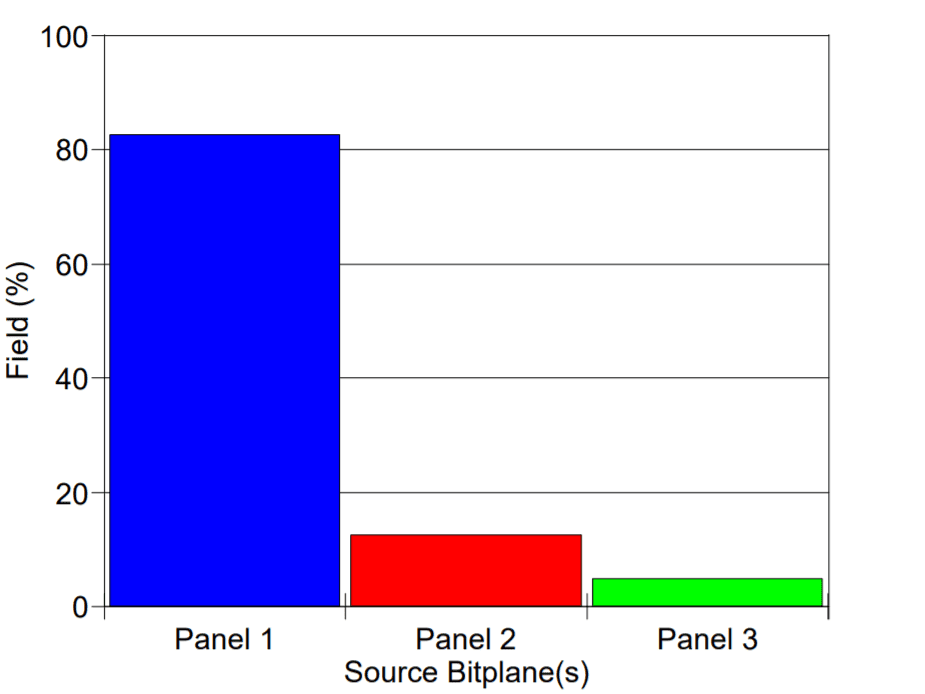
Phase Area Percentage Analysis
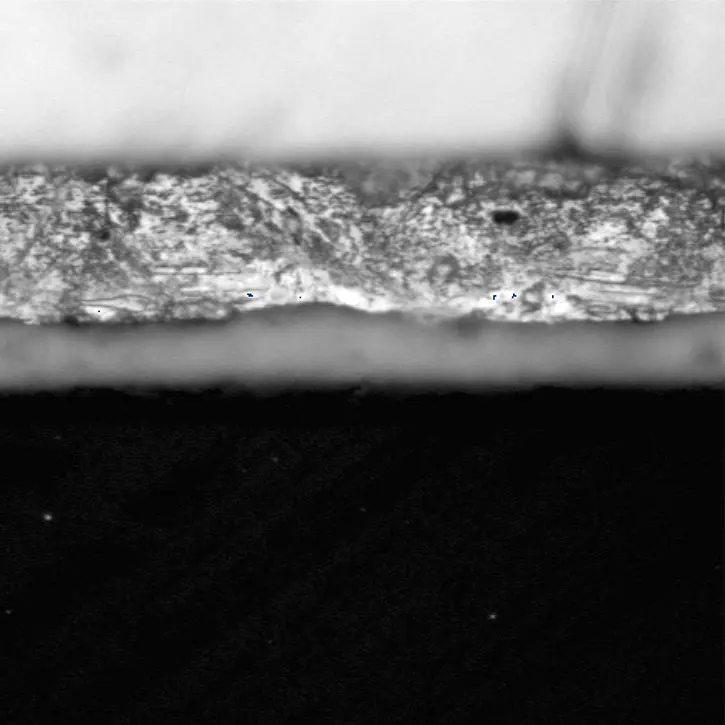
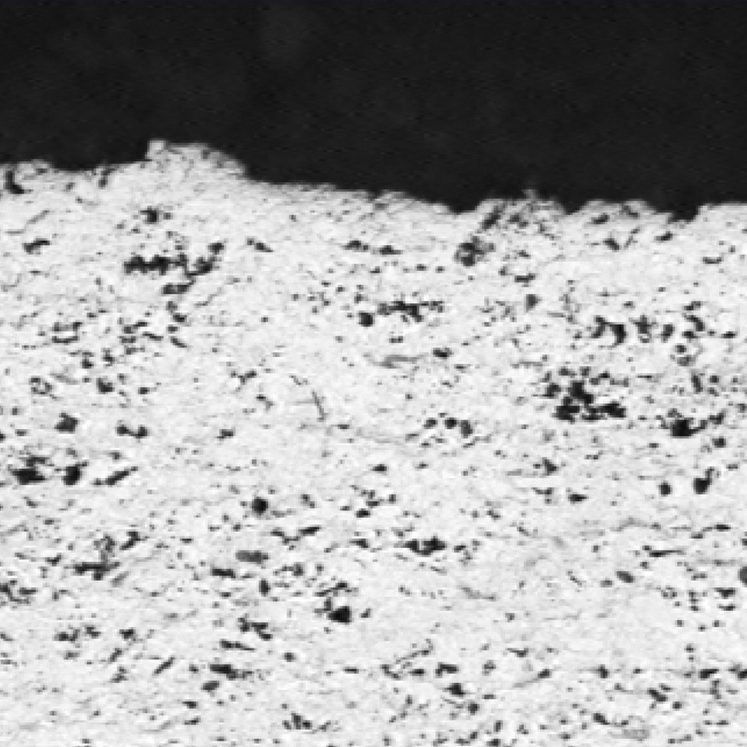
Six coated panels are submitted for analysis. Panels 4-6 represent finished multicomponent coatings with various concentrations of panel 1-3 (precursors used to give speckled effect).
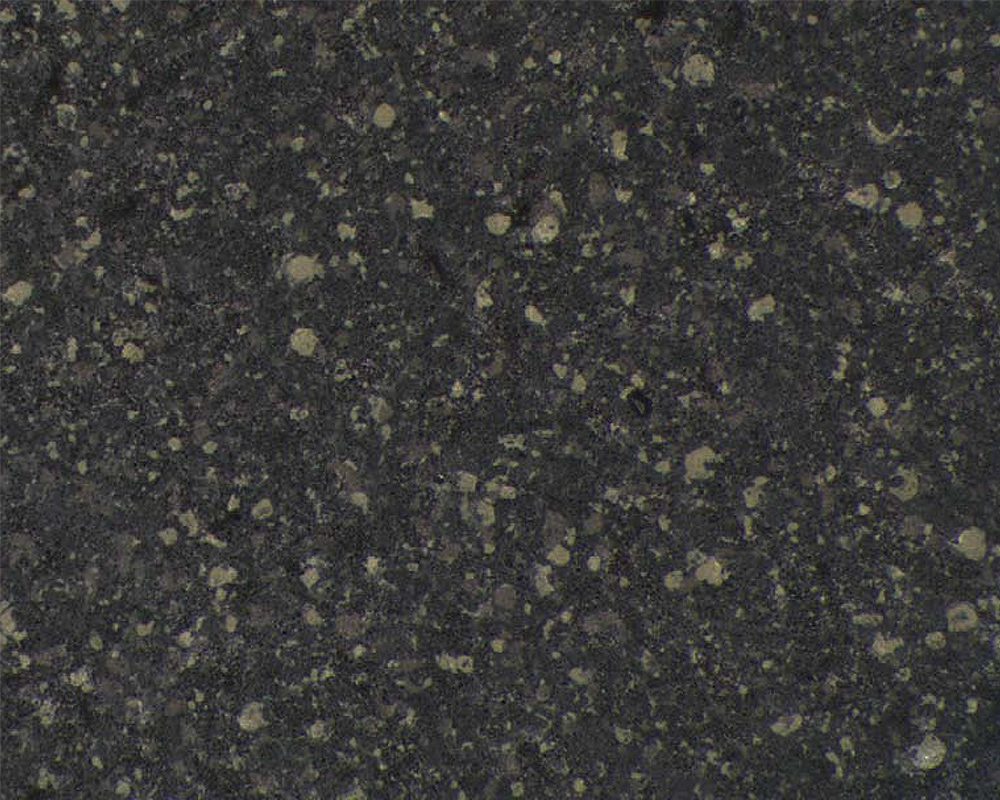
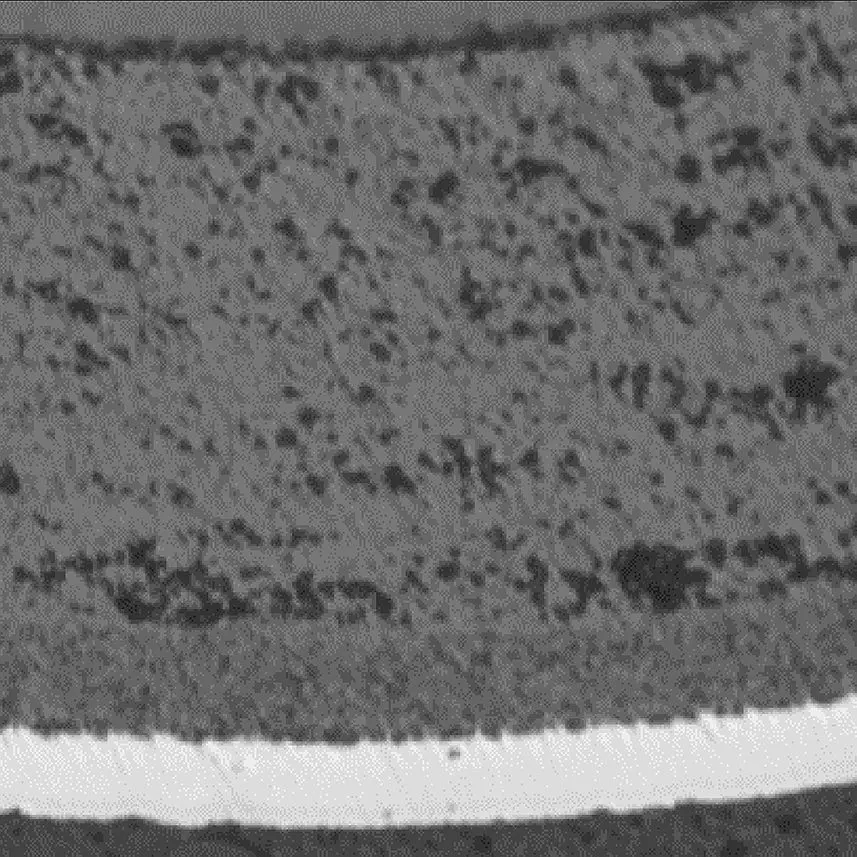
Figure 1. The microstructure of panel 4 is viewed at 25X magnification.
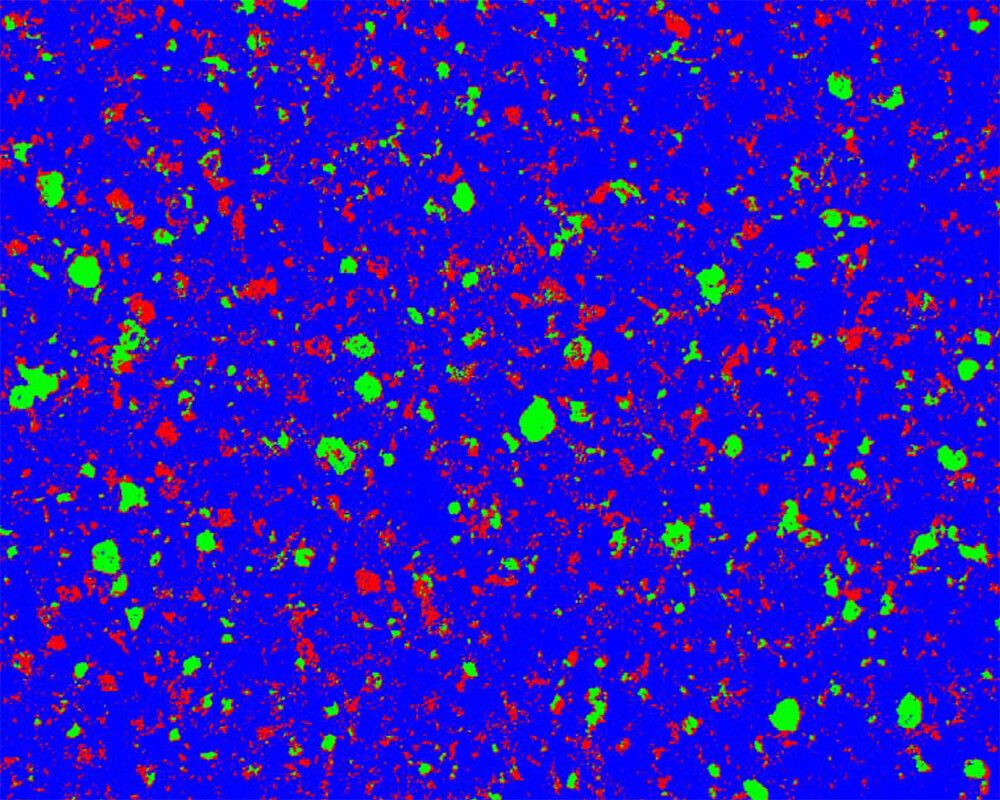
Figure 2. Phase as measured: Panel 1 in blue, panel 2 in red and panel 3 in green. Reference panels (1-3) are binarized individually to obtain the reference color/gray level range associated to each of them. This reference is then used to binarize samples 4 to 6.
PURPOSE
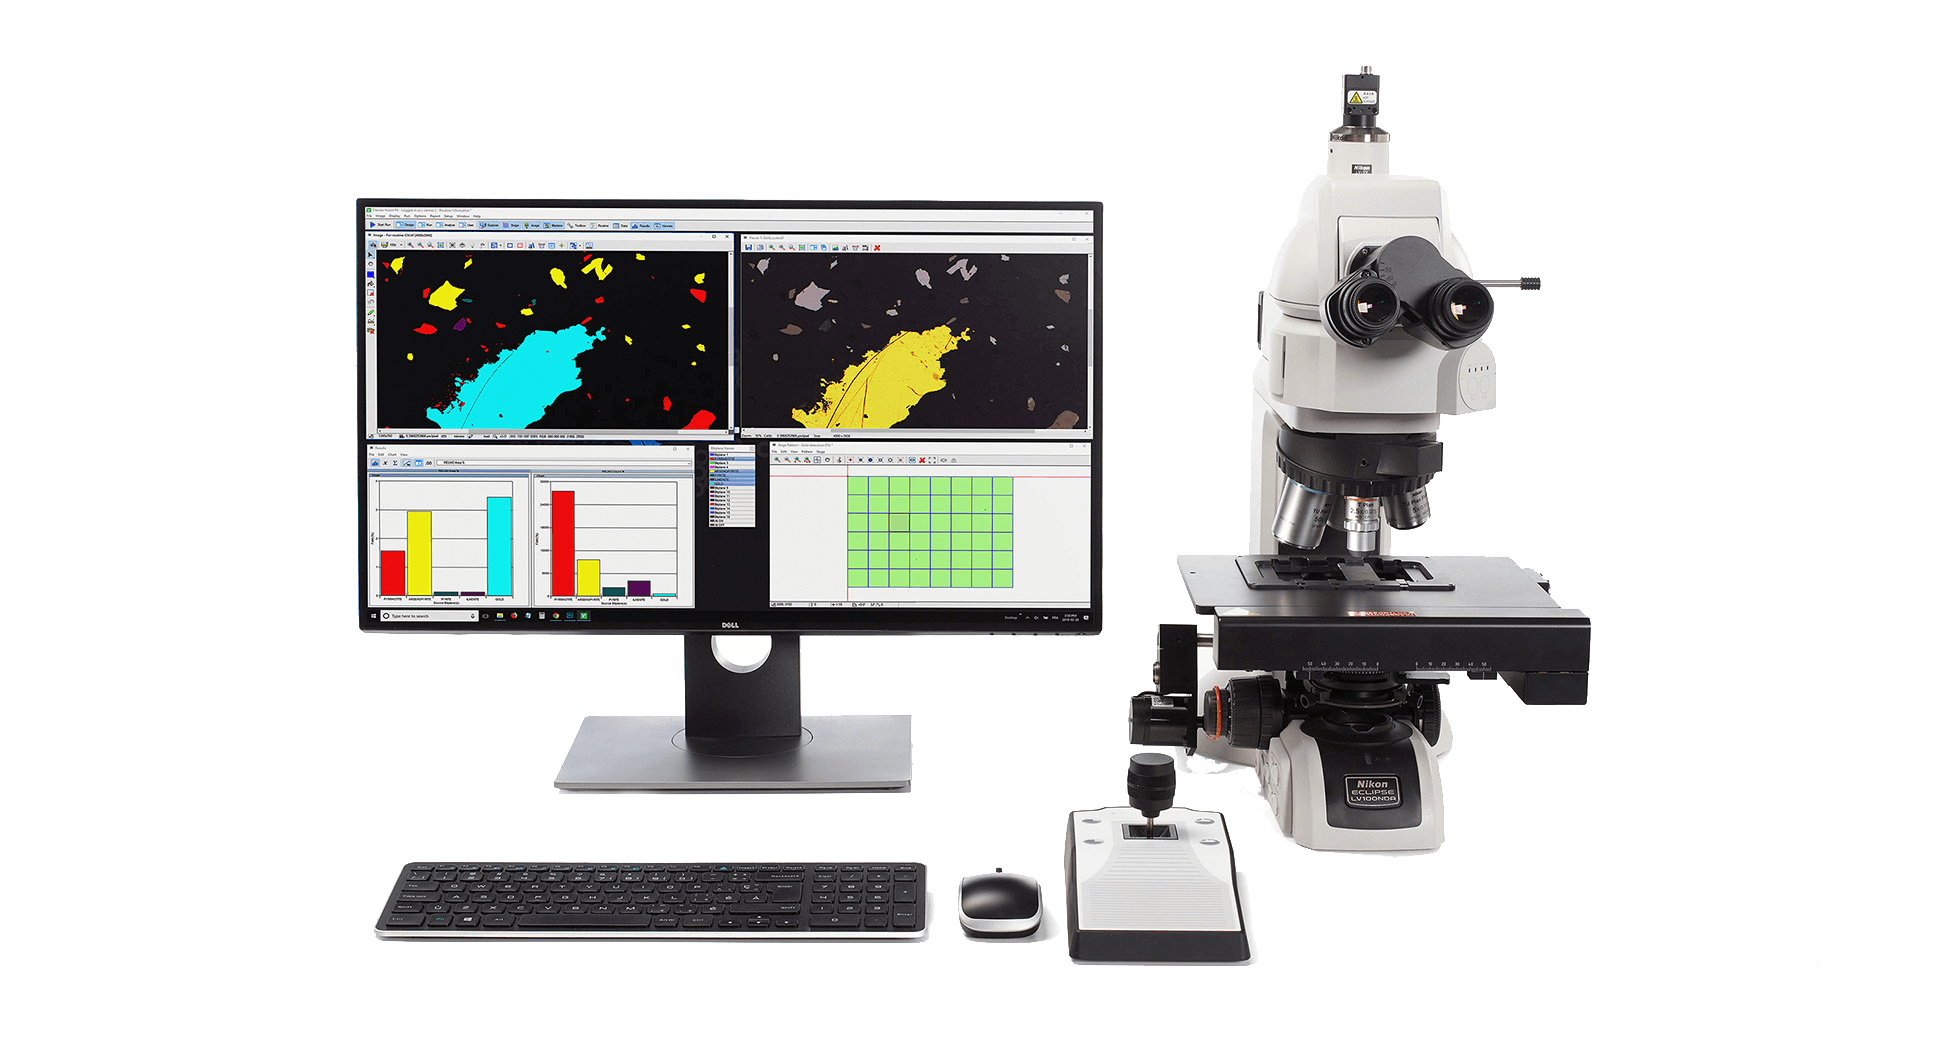
Demonstrate the ability of the Clemex Vision image analysis system can distinguish phases according to their gray (or color) level range and perform size measurements on them. The methods and operations used are discussed in the report linked at the bottom of this page (click the Download PDF link below).
RESULTS
Length measurements are performed on each feature. Area percentage of each phase is also performed. Automated statistics and graph are generated and cumulated during the analysis of the sample. Final results can be printed directly from Clemex Vision. Raw data can be exported in Excel format.