Phase Analysis Module
Phase quantification is a critical quality indicator across industries, from steel and cast iron production to ceramics, coatings, and composite manufacturing. Yet traditional measurement methods are manual and slow. Clemex's Phase Analysis module eliminates these bottlenecks with automated detection that measures and reports on every phase automatically, regardless of phase count, contrast, or microstructure complexity.
Stop thresholding phases by hand. Clemex automates what used to take hours in seconds.
Check phase analysis reports
See It In Action
Phase Analysis in Motion
Sample Micrographs
Examples of Phase Detection
The detection engine is validated across the common range of stereology samples, from simple single- and two-phase alloys to complex multi-phase composites with distinct particle populations.
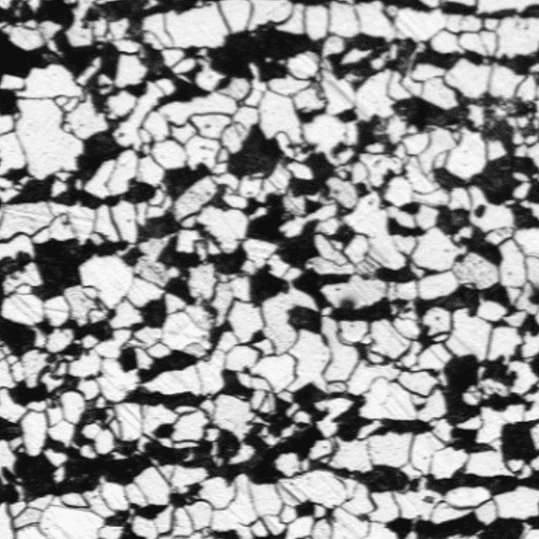
Two Phases (Grayscale)
A classic two-phase microstructure separated purely by gray-level contrast. Straightforward for automated threshold detection with no manual correction needed.
Two Phases + Particles (Grayscale)
A matrix and a secondary phase with a scattered fine particle population. Tests whether small, low-contrast features are still picked up as their own connected components.
Three Phases (Color)
Three phases distinguished by hue and tone rather than brightness alone, typical of etched or tint-etched optical sections. Needs RGB-space detection rather than a simple threshold.
Three Phases + Particles (Color)
Three color-separated phases plus a distinct particle population. A good stress test for cluster count and for particle/pore tagging.
Two Phases + Particles (Color)
A dominant phase with a small number of isolated colored inclusions. Useful for checking mean feature size and size range reporting on sparse populations.
Up to 5 Phases (Grayscale)
A complex multi-phase microstructure with several gray-level bands. Exercises the full multi-cluster grayscale separation path.
Up to 5 Phases (Color)
The most complex case: up to five phases separated by a mix of hue and brightness. Best handled with RGB detection.
Three Phases + Particles (Grayscale)
A three-phase grayscale microstructure with an irregular particle population overlaid on a fibrous matrix. Tests threshold separation between three gray bands plus fine particle detection.
Two Phases (Color)
A mottled two-phase microstructure separated by hue and saturation rather than sharp boundaries. A good check on RGB detection when phase edges are diffuse.
Three Phases (Grayscale)
A single grain-like region with three distinct gray-level phases and a network of internal boundaries. A clean case for validating three-way threshold separation.
How It Works
Automated Phase Analysis Workflow
A fully automated, four-step pipeline takes your micrograph from acquisition to final statistical report.
Image Acquisition
Micrographs are captured and loaded directly into the workflow. Compatible with optical and SEM systems.
Phase Detection
Thresholding or AI detection operations isolate each phase independently, even when phases share similar gray levels.
Phase Analysis
Each detected phase is measured directly from the segmented image, area fraction, feature count, and intercept chord lengths are computed automatically.
Report Generation
Area fraction (%), feature count, and mean size per phase are automatically compiled into a traceable report.
Detection Modes
Two Ways to Separate Phases
Clemex offers two complementary detection modes so every microstructure, from high-contrast alloys to same-gray composites, can be separated reliably.
Automated Threshold Detection
- Single- to Multi-Phase
- High-Contrast Boundaries
- Fast & Deterministic
Automated AI Detection
- Same-Gray Phases
- Single- to Multi-Phase
- AI-Driven Contrast
Measurement Outputs
Comprehensive Phase Metrics
Every phase analysis delivers a complete set of quantitative outputs per detected phase, from area fraction and feature sizing to mean free path.
Area Fraction (%)
Share of total image area occupied by each phase, the pixel count of that phase's label divided by total pixels.
Feature Count
Number of discrete connected regions per phase, found via connected-component labeling on the segmented image.
Phase Distribution
Relative share of each detected phase across the image, ranked by area, a quick visual read on which phase dominates the microstructure.
Size Range (Min / Max)
Smallest and largest feature area detected within a phase, useful for spotting outliers or segmentation noise.
Mean Free Path
The total chord length of a phase along a linear-intercept sampling grid, divided by its intercept count (λ = Σlᵢ / N).
Key Features
Everything You Need for Phase Characterization
A standards-based workflow covering image compatibility, configurable detection, and phase-count flexibility.
Broad Microstructure Compatibility
Works with optical or SEM micrographs from any imaging system, calibrated to physical units with a single scale factor.
Standards-Aligned Stereology
Volume fraction is estimated per ASTM E562 conventions (Aₐ = Vᵥ), with feature spacing determined via linear-intercept sampling and Fullman's relation reported as a cross-check. For direct point counting, see the Volume Fraction by Manual Point Counting module (ASTM E562).
Configurable Detection Parameters
Threshold, phase count, and grid spacing adjust to the sample, with any phase flaggable as a particle or pore population.
Single- to Multi-Phase Detection & Analysis
Handles single-phase materials through five-phase composites, using threshold or AI-driven detection as needed.
Frequently Asked Questions
What's the difference between area fraction and volume fraction?
By the Delesse principle, the area fraction measured on a random polished cross-section is, on average, equal to the volume fraction of that phase in the bulk material (Aₐ = Vᵥ). This is the basic reason a 2D section can stand in for a 3D volume fraction, provided the section is representative and randomly oriented relative to the microstructure. To measure volume fraction directly via manual point counting, check our Volume Fraction by Manual Point Counting module as per ASTM E562.
How many fields of view are needed for a representative result?
A single field rarely captures the full variability of a microstructure. Standard stereological practice is to measure several fields spread across the sample and average the results, more fields tighten the statistical confidence on area fraction and mean free path, particularly for coarse or non-uniform microstructures.
Does sample preparation affect the results?
Yes, significantly. Polishing quality, etching contrast, and illumination all determine how cleanly phases separate by gray level or color. Scratches, pull-out, or uneven etching can be misread as phase boundaries or particles, so consistent preparation matters as much as the analysis method itself.
Can we use AI detection or threshold detection?
Both are available, and the right choice depends on the sample. Automated Threshold Detection is faster and works well when phases have distinct gray-level contrast from one another. Automated AI Detection is better suited to complex samples where phases share similar gray levels and can't be separated by a simple threshold, its detection approach finds the contrast that a fixed threshold would miss.
Can this handle composites with more than five phases?
The methodology is validated up to five distinct phases per image, which covers the large majority of metallic, ceramic, coating, and composite microstructures. Beyond five phases, adjacent clusters typically need to be merged or the sample re-imaged at higher contrast to keep phases separable.
Ready to Apply This to Your Own Microstructures?
Talk to a Clemex expert and get a live demo on your own sample images. No commitment required.