Surface Roughness Module (ASME B46.1)
Surface roughness is a critical indicator of how a machined, coated, or textured surface will perform in service, and ASME B46.1 defines the standard set of parameters used across industry to quantify it. Clemex's surface roughness module computes these parameters directly from cross-sectional micrographs, extracting a single line profile, one or two coating interface profiles, or a full 3D reconstruction of the sampled area, depending on what the surface and the application demand.
Quantify roughness the way ASME B46.1 defines it. Trace a single profile, evaluate both edges of a coating layer, or reconstruct the full sampled area in 3D for a complete statistical picture of surface texture.
See It In Action
Surface Roughness Analysis
Analysis Workflow
A General Surface Roughness Workflow
Regardless of which mode is used, roughness measurement in Clemex Vision follows the same underlying workflow as per ASME B46.1, with only the profile geometry and level of reconstruction changing between modes.
Capture & calibrate
Capture or load an image of the polished sample at a known magnification and calibration.
Define the mean line/plane
Select a profile line, coating interface, or full area; the mean line or mean plane is computed as the reference.
Extract the profile
Deviations from the mean are extracted along the evaluation length or across the full field.
Generate report
Ra, Rq, Rt, Rp, and Rv are computed per ASME B46.1 and compiled into a report with the profile plot and source micrograph.
Analysis Modes
Three Ways to Assess Surface Roughness
Clemex Vision supports three modes of analysis within the same roughness module, so the evaluation geometry can be matched to the surface being characterized.
Linear Roughness Evaluation
A single profile line is traced across a machined or textured surface. Deviations from the mean line are computed along the evaluation length to yield Ra, Rq, Rt, Rp, and Rv, exactly as defined by ASME B46.1.
Coating & Interface Roughness
The same linear routine is applied to one or both interfaces of a coating layer in cross-section, isolating substrate roughness, coating roughness, or both independently on a single field.
1 or 2 edges per fieldArea (3D) Roughness Evaluation
The full sampled area is reconstructed in 3D from the image field, and roughness is computed as deviation from the mean plane across every point, giving a complete statistical picture rather than a single line.
Full-field statisticsChoosing the Analysis Mode
Linear vs. Coating Edge vs. Area (3D)
All three modes compute the same ASME B46.1 parameters, Ra, Rq, Rt, Rp, and Rv, from deviations relative to a mean line or mean plane. What changes is the geometry being evaluated: a single profile, one or two coating interfaces, or the entire sampled field reconstructed in 3D.
| 1 · Linear (Profile) | 2 · Coating Edge | 3 · Area (3D) | |
|---|---|---|---|
| Best suited for | Machined, ground, or textured flat surfaces | Coating/substrate or coating/coating cross-sections, 1 or 2 sided | Any surface where a full-field, statistically robust result is needed |
| Reference | Mean line over the evaluation length | Mean line for each traced interface | Mean plane over the entire sampled area |
| What's traced | One profile line across the surface | One or two interface lines in cross-section | Nothing manual; the full field is reconstructed automatically |
| Reported values | Rq, Ra, Rt, Rp, Rv, L, N | Rq, Ra, Rt, Rp, Rv, L, N per interface (top/bottom) | Rq, Ra, Rt, Rp, Rv, Lx, Ly, Area, N |
| Result basis | Single 2D profile | Independent 2D profiles per interface | Full 3D surface map |
What Gets Measured
Parameters Computed per ASME B46.1
Whichever mode is used, the module reports the same standard set of amplitude parameters, giving a consistent basis for comparing surfaces across samples and fields.
Amplitude Parameters
Average Roughness
Ra: Arithmetic mean deviation
The average absolute deviation of the profile (or surface) from the mean line or mean plane over the evaluation length or area.
Rq: Root mean square roughness
The RMS deviation from the mean line or plane; more sensitive to occasional large peaks or valleys than Ra.
Rt: Total peak-to-valley height
The vertical distance between the highest peak and the deepest valley across the entire evaluation length or area.
Peak & Valley Parameters
Extremes & Sampling
Rp: Maximum peak height
The height of the highest point above the mean line or mean plane within the evaluation length or area.
Rv: Maximum valley depth
The depth of the deepest point below the mean line or mean plane within the evaluation length or area.
L / Lx, Ly & N
The evaluation length (or Lx/Ly field dimensions for area analysis) and the number of sampled points N used to derive each statistic.
Analyzing multiple fields per sample, rather than a single field, produces a more statistically representative roughness result regardless of the mode used.
Surface Roughness Analysis Examples
Where the Roughness Module Is Used
Real micrographs and analysis reports from the Clemex Vision surface roughness module, spanning the linear, coating-edge, and area (3D) modes as per ASME B46.1.

Area Roughness: Full-Field 3D Reconstruction
A single field is captured and reconstructed in 3D, then color-mapped by distance from the mean plane across the entire sampled area for a complete statistical picture of surface texture.

Linear Roughness on a 3D Reconstruction
A single profile line (highlighted in magenta) is traced across the reconstructed surface, isolating one line's worth of deviation from the mean for direct ASME B46.1 evaluation.
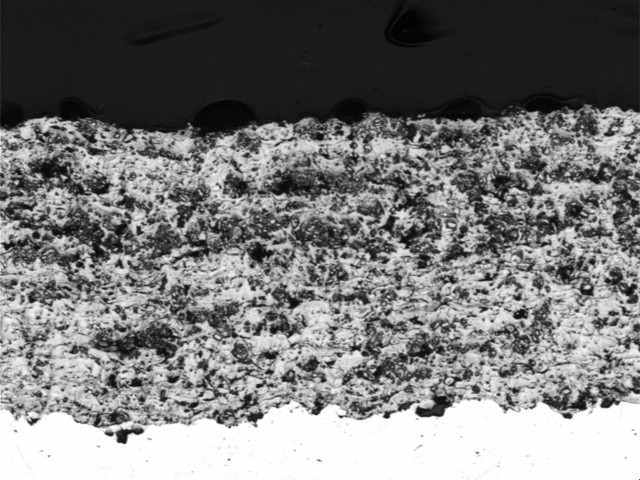
Porous Coating: Single Edge
The coating/substrate interface of a porous coating cross-section is traced along its evaluation length to characterize the roughness of that single edge.
Porous Coating: Top & Bottom Edges
The same coating cross-section is evaluated on both interfaces independently, revealing a rougher bottom edge than top edge on the same field.
Frequently Asked Questions
What is ASME B46.1 and what does it standardize?
ASME B46.1 is the standard defining surface texture parameters and the methods used to measure them, including the amplitude parameters (Ra, Rq, Rt, Rp, Rv) that the Clemex Vision roughness module computes from linear profiles or full 3D surface reconstructions.
What's the practical difference between Ra and Rq?
Ra is the arithmetic average of the absolute deviations from the mean line or plane, while Rq is the root-mean-square of those same deviations. Because Rq squares each deviation before averaging, it weights occasional large peaks or valleys more heavily than Ra does.
What do Rp, Rv, and Rt represent?
Rp is the height of the single highest peak above the mean line or plane, Rv is the depth of the single deepest valley below it, and Rt is the total vertical distance between the two, a measure of the full peak-to-valley range over the evaluation length or area.
Why measure roughness in 3D (area) rather than along a single line?
A single line profile only captures roughness along one direction across the surface. Reconstructing the full sampled area in 3D and computing deviations from a mean plane instead of a mean line gives a statistically complete picture of texture across the entire field, not just one path through it.
How is coating or interface roughness measured differently?
The same linear routine used for flat surfaces is applied to the coating/substrate interface visible in a cross-section. When both the top and bottom of a coating layer are relevant, each interface is traced and evaluated independently on the same field, producing two separate sets of Ra, Rq, Rt, Rp, and Rv values.
Ready to Assess Surface Roughness?
Talk to a Clemex expert about the linear, coating-edge, and area (3D) routines, or request a live demo on your own sample images.